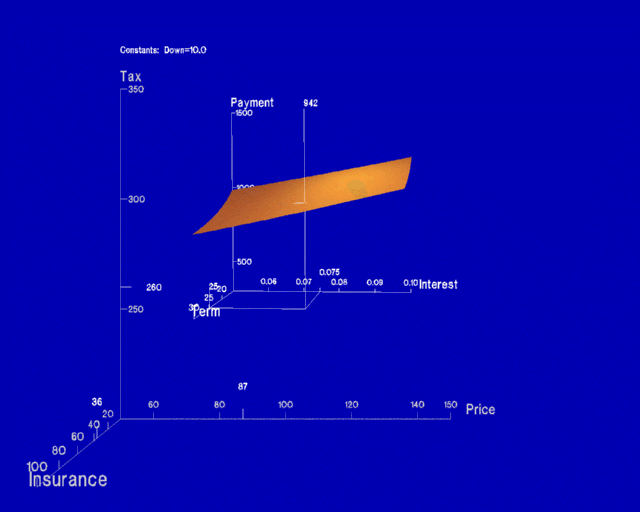
| Figure 4. Visualization generated for the mortgage search task. The visualization allows the user to set the price, property tax and insurance values for a particular house, and view the resulting mortgage payment as a function of the interest rate and the down payment. The line graph tool shows the payment as a function of the interest rate for a particular down payment. |