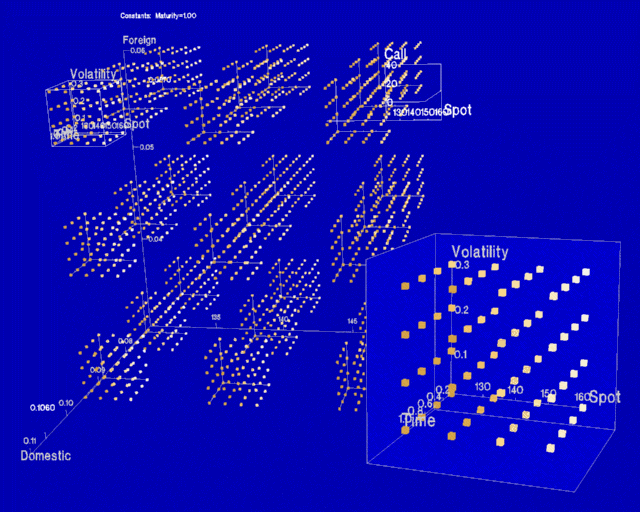
| Figure 5. Visualization generated for exploring a call option. AutoVisual chose the point cloud interactor because it encodes many variables. The hierarchy is populated with point clouds so that the visualization presents a summary of the function, with little or no interaction required by the user. The zoom tool can be used to examine the point clouds. The line graph tool redisplays a portion of a point cloud using a superior encoding technique. |
